Friday, April 1, 2011

Activity Based Management (ABM) and Enterprise Performance Management (EPM)


Now a day one can hear about the term Enterprise Performance Management (EPM) a lot of times in different ways. It also termed in different ways like CPM, EPM, PM etc. Sometimes it is also used interchangeably with the individual performance and organizational performance. There are various definitions also for EPM. I personally like the definition by Gary Cokins, which mentions that Performance Management is the process of managing the execution of an organization’s strategy. It integrates the business improvement methodologies with technology. So it is neither the methodologies only nor the technology in isolation.

As I have mentioned in my earlier posts, Activity Based Management (ABM) is the way to manage your business by managing the activities to provide improved value to the customer or organizational performance. After these definitions, we will try to see how these two things go together in different ways as concepts, execution and technology.

I personally believe that the EPM starts with the definition of the strategy. This is because if you do not know where you want to go, any way is a good way. Let us have a look at the following figure:


Defining the strategy for your organization, preparing business plan according to the strategy and then measuring the performance and analyzing the variances with reasons to modify the internal processes or strategy is a cyclic process. ABM fits into the ‘Measure and Analyze’ part of the cycle. Here the ABM model based on the business plan can provide the information on the resource requirement in the future as well measure the actual performance. Once you analyze the actual performance against the planned one, the same can be analyzed using various techniques like root cause analysis, continuous improvement etc. The analysis will tell whether one has to manage the processes to improve the customer value or organizational performance.

The performance management is also seen as the operational performance management or strategic performance management, as it is mentioned in the earlier part.


Operational performance management is looking at the processes to improve organizational performance and strategic performance management is looking at the processes to improve the value to the customer. The ABM model can be designed to manage the performance at both the levels. It can also be used for some tactical purposes as managing a customer segment or a product group etc.

Looking at all those things the tool vendors have combined their software solutions into one group as Enterprise Performance Management (EPM) suite. This suite generally includes the solutions for Strategy Management, Business Planning and Profitability & Cost Management. They project and try to sell these solutions as a suite. I have got the following figure from some document that I am not able remember, so please acknowledge the efforts of the person who has created it (if somebody knows it pl let me know, so that I can put the name in the acknowledgement).


In a very simple way, we will try to understand this diagram. It shows three differnet parts. Analytical toos as in the technological part that help us to alanyze the results. One may argue as to reporting is not exactly same as analytics. The second part is the analytical appliactions which are actually the software solutions based on the various business improvement methodologies. The third part is supporting tools ahich ehlp us to integrate the data and perform the administrative part for those solutions. All these solutions work on the same data mart or warehouse so as to provide one view of the data and these solutions use and provide data to the othersolutions through this data mart or warehouse.

If we see the Strategy Management methodology creates a strategy map, the Key Performance Indicators (KPIs) and corresponding action plans. Based on the strategic plan the budgeting and planning solution can create the business plan. It can also use the Profitability management solution (ABM) to create a driver based planning. ABM can also provide the actual values for various KPIs defined. The Activity analysis using the cost drivers and performance measures can provide information the performance of the organization vis-à-vis the planned one.

As we saw ABM fits into Enterprise Performance Management (EPM), conceptually as well as technologically and helps the organization to manage the performance at the strategic level as well as operational level (including the tactical one).




Tuesday, March 1, 2011

Should an organization use Activity Based Costing (ABC) when it is already making profits?


It is a common notion that an organization should seriously look at the costs when it is in a serious trouble. This trouble could be that they are making losses or a competitor has come with a similar product with lower price or a possibility of losing an order because of pricing. Cost is also seen as something that has to be reduced in any case. Generally because of this an organization is serious about understanding costs only when it seems to be making losses.

I have also mentioned in my earlier postings that when somebody talks about costing it is about the Product Costing. The management accountants have been trained professionally to take each and every unit of expense to the product. This is not true with any kind of business. There are some costs that caused by the products/services, some are caused by customers, some are caused by running the business and not related to any product or customer are some caused by the installed capacity. One should be able to segregate costs in the according these causes and relate them to the profit/loss the organization is making.

Activity Based Costing (ABC) has a word ‘Costing’ in it, so the same question arises for its use in the organization. ABC is based on the concept of ‘cause-and-effect’; hence it separates the costs that related product, customer, business and unutilized capacity. Even within the product and customer related costs, they are apportioned based on the consumption. With this calculation the organization can understand the costs related to the products, customers, channels etc. and take proper decisions based on the information.

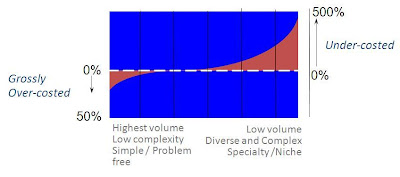
To explain this, let us see the following diagram. This diagram shows the relationship between cost of products with traditional costing and ABC.


The horizontal dotted line in the diagram represents the cost of products according to the traditional way of costing and the ‘S’ curves represents the cost of products using ABC. It is generally seen that few products are grossly ‘overcosted’ and more than that products are grossly ‘undercosted’. The products that are overcosted have more cost up to 50% and the products that are undercosted have costs less up to 500%. The primary reason for this incorrect cost calculation is that generally the overheads are taken based on the volume produced. The complexity of product is not considered. It is seen that the change in the overheads of the organization is related to the additional complexity of the business. This complexity could be added due to more products, more customers, more channels etc. It can also be introduced due to the complexity of the product features. This is complexity is generalized in the traditional costing and the same is converted into a logic for apportioning the overheads in ABC. It is generally seen after the ABC modeling that the organization is almost shocked after looking at the results. This is due to the fact that the products those were ‘dear ones’ earlier start looking loss making and vice-a-versa.

We will see another diagram, which is called with different names like profit cliff, whale diagram, profit umbrella etc. This diagram depicts the products or customers on the horizontal axis and the cumulative profit percentage on the vertical axis. This diagram can be plotted for products as well as customers. The following diagram is taken from one of the book written by Gary Cokins, who is an internationally known expert on Performance Management.


In this diagram the horizontal axis represents the products and the vertical axis represents the cumulative profit in USD millions. The current profit shown in the financial records is $ 2 mn. If we start analyzing the diagram, we can see that the same $ 2 mn is achieved by first 13% of the products. So from the products that are making most of the profits top 13% give you the current profit of $ 2mn. The story does not end there. The top 65% of the product by profitability provide the organization a profit of $ 8 mn (400% of current 4 2mn). Then there are some products are neither profit making nor loss making. And almost 15% of the products which are actually making loss, bring the profits from $ 8 mn back $ 2 mn.

So on the face of it the organization is making a profit of $ 2 mn. It may be also happy with that profit, but then it is not realizing that the potential of the organization is $ 8 mn and not mere $ 2 mn. With the use of ABC and then plotting this graph the organization can realize its potential. It can also understand the loss in profit it is making. More important that this, it will also understand which products are bringing the profit and which are taking away. A similar diagram for customer profitability shows which customers are profitable and which are taking away the profits.

This is where the ABC that is the costing part ends and Activity Based Management (ABM) starts. In ABM the organization looks at the costs analyzes them and takes proper action on the same. For the organization uses various techniques like root cause analysis, benchmarking, cost driver analysis etc. to understand the reason behind the profits or losses. So we not only understand ‘who/which’ are making profit and loss but also ‘why’ they are. Based on this information the organization can take series of actions so that it can optimize the profits by selling its best products to the best customers. It can also take actions to promote the loss making products/customers to profit making.

With these actions the organization can reach as near to its potential profit as it can. But the first and foremost understanding the organization must have is its profit potential. This potential is brought forward by using the ABC methodology. So even if know you are making profits and you are happy with the number, think again is that the real profit potential of your organization?


Tuesday, February 1, 2011

Strategic ABM (Activity Based Management) and Operational ABM


We will start with definition of Activity Based Costing (ABC). According to the CAM-I (www.cam-i.org) the definition of ABC is ‘method of costing products through costing the activities’. In ABC we calculate the cost of activities firs and then the cost of products. This does not mean we can calculate cost of products only. It is based on the concept ‘cause-and-effect’. The cost objects (products, customers etc.) consume activities. This means we perform activities for products, customers etc. The activities consume resources i.e. the resources (people, facilities, expenses etc) are utilized to perform the activities. Based on this logic the cost are flown to the products, customer etc. Generally the costs are can be grouped into product related, customer related, unused capacity and the rest are ‘business sustaining costs’.

Activity Based Management (ABM) is a methodology to manage your business. It is like various management techniques that have emerged over a period of time like Management by Objectives (MBO), Management by Exceptions (MBE) etc. Let us see the definition of ABM: it is the method to manage your business with managing your activities to improve operational excellence (internal) or value provided to the customer (external). ABM is calculation of costs with the ABC method then analyze the data and take action on it to improve your business performance.

ABM can be used to understand and improve the performance at all the levels in the organization. It can be used to take decisions about the products, customers etc (Strategic use). It can also be used by a head of the department to manage her portfolio of products or customers (tactical use) or to improve certain processes (operation use). Based on these uses few people have segregated it as ‘Strategic ABM’ and ‘Operational ABM’.

Strategic ABM – ABM can be used for the purpose of taking strategic decisions like adding or retiring products, acquisition or retentions of customers etc. These decisions are based on the profitability information calculated using ABC method. This information is historical information of profitability. This historical information coupled with the future trends, competition etc can help the organization to take the decisions. In other words it is ‘doing the right things’.

The ideal way of performing for an organization is to sell best of their products to best customers. For this the organization has to understand which their best products are and who their best customers are. ABC helps the organization to find their best products and customers as per the profitability. Once the organization has to find out the profitability, it can then group them into deciles (make 10 groups according to their profitability numbers). Each of deciles can be analyzed for products and customers as to what are the reasons for those to fall into that category. Then various action plans can be taken to move them from lowest of the deciles to the highest. As I said this is a historical data of profitability, one has to look for the potential future trends and couple them with current (and historic) data to take the strategic decisions.

ABM models for Strategic ABM are at a comparatively gross level. The activities are defined at almost a process level. Now a day we can calculate the profitability of the products even at SKU (stock keeping unit) level, in the hierarchy LOB-Product Group-Product-SKU. We can also calculate the profitability at account level in banks, subscription level in telecom. This can be grouped at the customer level, household level or other customer segments.

Operational ABM – In this case the use of ABC information is for improving the performance of various operations (processes) in the organization. The process is nothing bust various activities performed in a sequence by one or more functions in the organization. In this case various activities are tagged as ‘value add- non value add’ or ‘core, discretionary or sustaining’ and based on the analysis the activities are eliminated. Here I remember a methodology explained by Gary Cokins as:

a) See if the activity is required by the customer (internal or external). If the activity is not required then eliminate the activity

b) For the rest of the activities see if you reduce the recurrence of the activity. That means see if you can reduce how many times you have to perform the activity

c) Once this is done go one level down i.e. at the task level and repeat the steps mentioned above.

The activity costs can be analyzed by finding their ‘cost drivers’. Cost drivers are the causes of costs for the activity and typically ‘unit cost’ of the activity. For example;


When one wants to improve the cost of an activity, one has to work on those cost drivers. Once we analyze and take action plan to improve on those cost drivers we can measure the performance of the activity. Performance can be measured by at least three ways 1) productivity 2) cycle time 3) quality. This actually forms the horizontal view of the CAM- cross which is also called as ‘Process View’.

Sometimes the cost driver is used interchangeably with the resource driver and activity driver. The resource and activity drivers are nothing but the logic with which the costs are taken from resources to activities and from activities to cost objects.

ABM models for operational purpose are more detailed in the ‘Activity’ section. Here the level is taken to tasks. Most of the times these models can be created for each process separately. If you try to model everything in one then it may create implementation and maintenance issues for the model.

I have seen some of the consultants that do not use any software solution for modeling; it is very difficult for them to calculate the product, customer profitability in detail. They use the information of activity costs to improve the performance of the processes. So the ‘Strategic ABM’ and ‘Operational ABM’ are not altogether new concepts of ABM, but it is just what the concept is used for.

Saturday, January 1, 2011

Shared Service Costs using Activity Based Costing (ABC)


First of all, I wish you and your family a very happy and prosperous new year.

A shared service is an operational philosophy that involves centralizing administrative functions that were once performed in separate divisions or locations. Services that can be shared among the various business units of a company include finance, purchasing, HR and information technology. Shared Services is a service model designed to gain efficiencies in routine processing by leveraging common practices and enabling technology. In the earlier days the costs were not significant, but because of the IT services it has gone up. In some of the financial services companies or telecom companies the cost of IT function contributes more than 25% of the costs.

The primary objective of forming the share service departments is to leverage the economies of scale to improve the cost as well as the productivity of the departments. Some of the other drivers for moving to shared service model are a) Process standardization b) Process improvements c) headcount reduction d) Improve service levels e) Increase control f) in case of mergers it is used to capture the synergies. All these objectives look logical as well as moving towards the improved performance. But still the recipients of the services do not seem to be happy with the costs. This is generally because there is not transparency in the calculation of the cost of the services. There is also no relationship seen between the volume demand from the business units and the cost of the services.

The typical method of allocating these costs to the business units is headcount, capital employed, revenue, area occupied, # of users, # of workstations etc. These statistical keys may not always relate to the volume of the services received by the business unit. The planning of the shared services is also not in line with the business volume planning of the units. With this situation the utilization of the shared services is not in line with the business units’ volume requirements.

The chargeback system for the shared services should be

a) Equitable – It should be fair to all the recipients. There should not be any kind of cross-subsidization among the business units. This may generally happen when the basis of distribution of cost is ‘Revenue’ or ‘Headcount’. The business units should pay for the capacity of the resources they use. The underutilization of the shared service department should be charged to the business units. This overcapacity can result as there is no relation between the requirement for the business units and the resource planning by the shared service departments.

b) Repeatable and Accurate – The cost of the service should be the same irrespective of the time. It should cost the same across the year for the same volume requirements. Assuming the same input it should consume the same level of resources every time.

c) Understandable – Both the service provided and the business units should understand the methodology of charging the costs.

d) Predictable – The business units must be able to predict the costs of the services. They can plan for the higher volumes if required. In turn the service provider can plan the resources as per the requirement of the business units.


Activity Based Costing (ABC) can be the answer to reduce the conflicts between the service provider and the business units and also fulfill the requirements for the good cost allocation method. In ABC the model for shared service cost calculation can consider various shared service departments like IT, HR, Procurement, Facilities management and define their services (as activities) and business units as the Cost Objects. Sometimes the services provided can be defined as the ‘Services’ in the Cost Object and Business units as the ‘Customers’. In that case the activities are the various steps for completing the services. Some of the consultants create a separate model for the shared service cost calculation only. The final model starts with the resource costs as per the cost center accounting plus costs from the shared service model.

Let us consider the various services that can be defined for the departments.

a) Accounts payable – Vendor payment, employee reimbursements

b) Accounts receivable – Billing, accounting for receipts, ageing reports

c) HR – Recruitment, training, grievance management, performance measurement, payroll

d) IT – Application management, infrastructure management, help desk – applications, help desk – hardware

e) Corporate services – Travel management, facilities management, internal functions management

In the first step the demand for various services is collected from the various business units. Based on this demand and the various activities required and the time taken by various activities the total resource requirement is calculated. In this way the resources of the shared service departments can match with the business plan of the business units and they can plan for the resources for themselves. This in turn saves the business units being charged for the unutilized capacity of the shared service departments.


Once this demand is converted into the resource requirement and the same is planned for, the second step is calculating the cost of those services. For the all the costs for the shared service department is accumulated as a cost center. Care should be taken that these shared service department as providing services to the other are also receiving services. For example as IT department is providing services to HR, it is also services from HR department. This ‘reciprocal’ assignment of cost should be modeled properly. Once all those costs are collected, they flow through the ABC model and calculate the unit costs for each of the service. Then based upon the volume of services availed by the business units the cost is allocated to them. In this way even if there is any excessive capacity in the shared service department, it is not transferred as cost to the business units.


In this way the business units can see the unit cost of the shared services and they can either question the shared service departments for the same or if allowed they can avail the services from the third party. Sometimes the ‘Employee self service’ program is also taken by the business units. In this program the employees perform the services for themselves. This reduces the cost of the organization and the satisfaction levels can be matched. The performance of the shared service departments can be improved by creating the ‘Service level agreements (SLAs)’ and/or defining the performance indicators for the services. At least three types of performance indicators can be defined.

1) Productivity type – Cost per service

2) Cycle time type – Time taken to perform the service

3) Quality type - % of times the service is provided with required quality

Activity Based Costing (ABC) models for shared service departments help the organization to achieve their goals for the initiative as well as provides transparency in allocating costs and utilization of resources of the shared service departments. The planning of the shared service departments can happen in line with that of the business units.